- Geomedia consists of all the visual tools we use to retrieve and understand geographical information.
- Diagrams, images, videos, models, charts statistics, maps, GPS locations etc. are all forms of geomedia.
- Geomedia has been an important part of geography all throughout history, and is constantly changing with new innovations.
- For example maps used to be on paper and required various tools to estimate your location, now maps are easily accessible and can pinpoint exact locations.
Maps
- Maps are a reduced and simplified image of Earth which can show large amounts of information.
- Maps are essential for navigation on small and large scales, whether it be hiking in a forest or sailing from one continent to the other.
- They are the most typical form of geomedia.
- Maps generally used colors and symbols to signify different types of information, these are always communicated through the map legend.
- Maps can come in many different forms, but are generally divided into two categories.
- These are physical and thematic.
- Physical maps show physical and topographic features such as natural landmarks and borders.
- Thematic maps show a distribution of a particular theme in a geographical area.
- For example population density, climate or age distribution in different countries or regions.
- They show things that can't be easily seen in real life.
- The difference between physical and thematic maps can be a little hard to determine at times
Scale
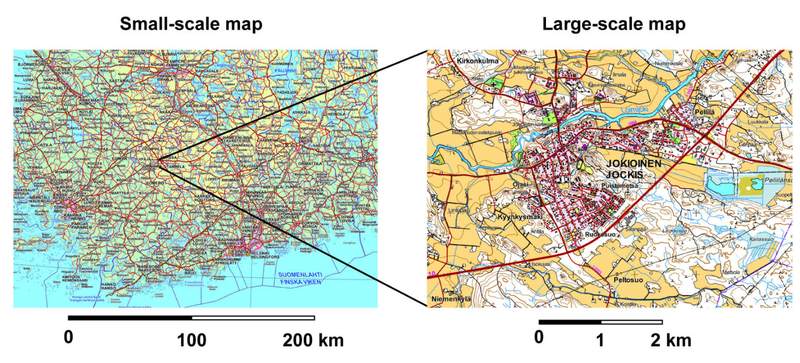
- Maps come in different scales to show certain places with more detail.
- The scale indicates the length of a distance on a map in relation to the length of distance in nature.

- Small-scale maps show a large but the depiction of terrain thus has to be smaller and generalized.
- Large scale maps depict a smaller area but showcase terrain larger and with more detail.
- The scale is written as a ratio.
- For example a scale of 1:50 000 means that 1 centimeter on the map is 50 000 centimeters in real life.
Projection
- Because of the rounded shape of the globe, it is impossible to accurately portray the world 2-dimensionally.
- For example you can imagine peeling a tangerine and trying to flatten the peel. It is impossible without distorting the shape of the peel as it will always be rounded.
- Thus often in map projections details can be distorted.
- There are many different projections that all give up something in order to achieve something else.
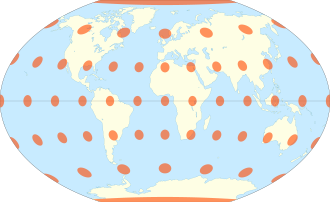
- The distortions can best be seen by placing dots across the globe and seeing how they malform in a projection.
- For example the Winkel tripel projection attempts to minimize all flaws.

- Alternatively the Mercator projection, which was previously used for Google Maps is good for accurate directions but sacrifices proportionality of countries.
- Meanwhile the Gall-Peters projection shows the areas equally but the shapes are very distorted.
GIS
- GIS or geographic information systems are one of the fastest growing fields in geography and information technology.
- Many companies provide GIS as applications or web services, such as Google Maps, Apple Maps and Bing Maps.
- They are a combination of location and attributes.
- Different types of map layers are created, which can be combined in order to study spatial phenomena.
- For example one map layer would show elevation while another would show road networks.
- Each map layer contains both location data and attribute data.
- Combined map layers can create for example, a map that showcases the effects of rising sea levels.
Image Sources