Unemployment Graphs
- Real wage goes in the y-axis and quantity of workers goes in the x-axis.
- ASL is the aggregate supply of labor, and functions similarly to the SRAS curve on an aggregate demand graph.
- Likewise, ADL is the aggregate demand for labor.
- W is a point on the y-axis that represents the wage and Q is a point on the x-axis that represents the quantity of workers.
- Workers supply labor and firms demand labor.
- Because of cyclical unemployment, aggregate demand on an aggregate demand and supply graph has an affect on the demand for labor.
- A decrease in AD (due to a recession) can cause a decrease in the demand for labor, thus leading to unemployment.
Effects of Minimum Wage
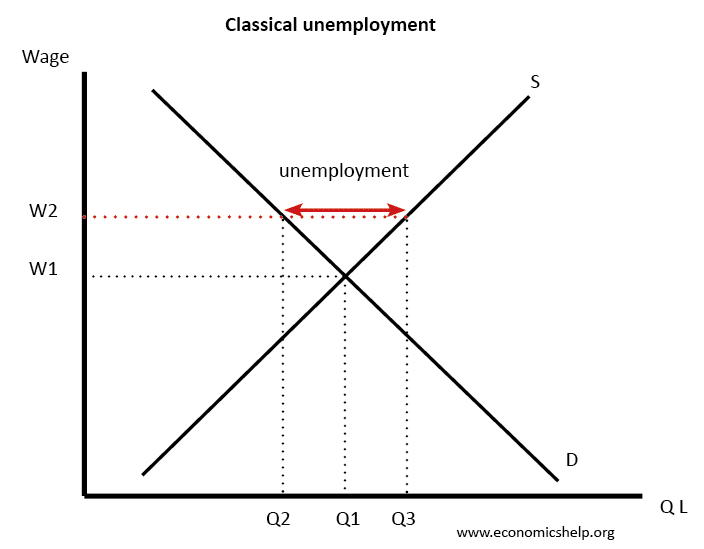
- Minimum wage acts like a price floor on wages, making them unable to go below a certain threshold.
- The minimum wage is generally placed above the equilibrium point, and it can create a gap between demand and supply, leading to unemployment.