What is Total Revenue?
- Total revenue is the money a good will be making at a specific price level.
- It is calculated by multiplying quantity demanded and the price.
- TR = QD x P
- Total market revenue is the sum of all the total revenues in a market.
Example: Firm A selling cupcakes makes has a total revenue of $5000, and Firm B selling muffins has a total revenue of $6000. The total market revenue of sweet pastries is:
$5000 + $6000 = $11000
Note: An increase in total revenue does not necessarily mean an increase in profit! Total revenue only accounts for the amount of money you gain but does not account for production costs.
Total Revenue and PED
- The price elasticity of demand affects how total revenue changes with changes in price.
- The change in total revenue depends on whether the good has elastic or inelastic demand.
Inelastic PED
- Price: increase
- TR: increase
- Quantity demanded decreases less relative to the increase in price, meaning total revenue increases as you're selling slightly less amount of goods for a higher price.
- Price: decrease
- TR: decrease
- Quantity demanded increases less relative to the decrease in price, causing a decrease in total revenue as you're selling only slightly more goods for a lower price.
Elastic PED
- Price: increase
- TR: decrease
- Quantity demanded decreases more relative to the increase in price. Total revenue decreases as you're selling a lot less goods for a slightly higher price.
- Price: decrease
- TR: increase
- Quantity demanded increases more relative to the increase in price. Total revenue increases as you're selling a lot more for only a slightly lower price.
Unitary Elastic PED
- Price: increase/decrease
- TR: no change
- Any change in price results in an equal relative change in demand. Total revenue doesn't change as for any increase or decrease in price you'll be selling equally less or more.
The Effect of Changing PED Along A Demand Curve on Total Revenue
Warning: Abandon all hope, all ye who enter! This is an HL topic!
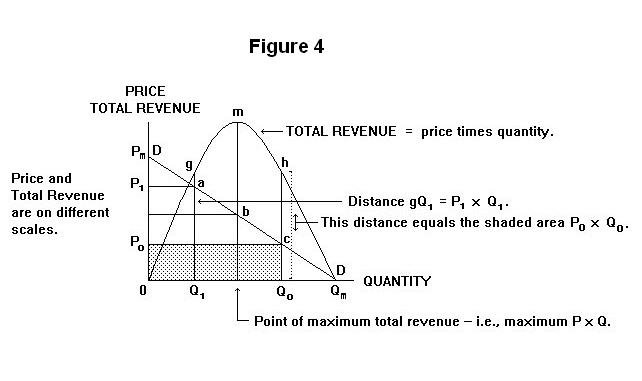
- As price elasticity of demand changes over the demand curve, this is reflected in a total revenue to quantity demanded graph.
- The total revenue along different points on the demand curve can be expressed as a graph.
- The curve appears as an arc where the total revenue is the highest in the middle, and is 0 when quantity demanded is the most (when price is 0) and when quantity demanded is 0.
- This is because revenue is 0 when either quantity demanded is 0 or when price is 0.
- Total revenue will always be highest when the price is a point at the middle of the demand curve.

Sources