What is the Phillips Curve?
- The Phillips curve is a diagram representing the relationship between unemployment and inflation.
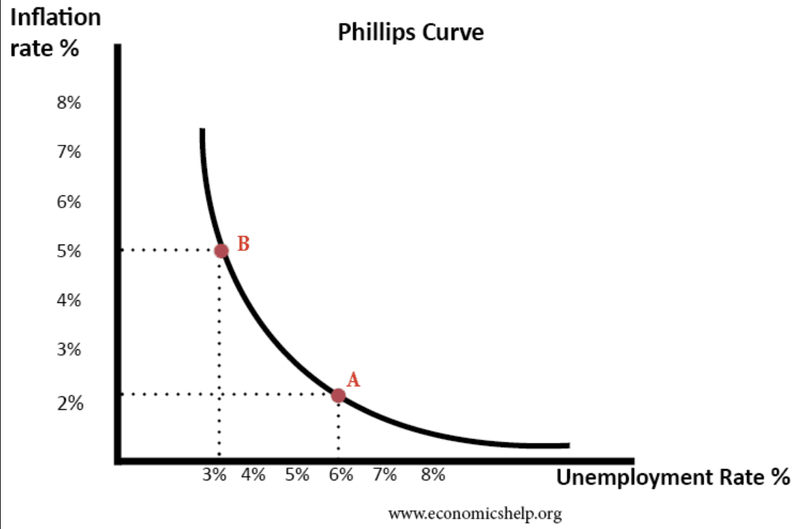
- It can be modelled as a graph which shows an inverse relationship between unemployment and inflation.
Essentials of the Phillips Curve
- Inflation rate (%) on the Y-axis
- Unemployment rate (%) on the X-axis
- Two types of Phillips Curve
- Short run (SRPC)
- Long run (LRPC)
Long-Run Phillips Curve
- The Phillips curve theory was supported by data up to the 1970's, where stagflation lead to high unemployment and high inflation at the same time.
- The LRPC represents the idea that there is no trade-off between inflation and unemployment.
- LRPC = Natural rate of unemployment (NRU) or full employment
- It appears as a straight vertical line.
Milton Friedman vs the Phillips Curve
- According to neoclassical economists, the economy will tend towards its long-run equilibrium at the full level of output.
- Same goes for the long run Phillips curve (there is no trade-off in the long run).
- "Do not use expansionary demand-side policies to bring unemployment under the natural rate of unemployment, it will only create inflation."
- LRPC is unemployment at the natural rate of unemployment, NRU.
- NRU consists of frictional, seasonal and structural unemployment.
- Natural rate of unemployment will occur when the economy is at full employment and the labor market is in equilibrium.
- Supply side policies will reduce the natural rate and shift LRPC to the left.
- NRU per country depends on:
- Availability of unemployment benefits
- Trade union power
- Extent of labor market regulations
- Wage-setting practices by firms
Sources
https://www.economicshelp.org/search/phillips%20curve/page/5/