What Is the Income Elasticity of Demand (YED)?
- Income elasticity of demand, shortened to YED, is one of the main elasticities in economics.
- It is a coefficient that describes how the change in people's incomes causes an increase or decrease (a shift) in demand for a good.
- The extent to which direction the demand curve will shift is explained by the income elasticity of demand.
- It is a measure of how much the quantity demanded of a good will change in response to a change in consumer's income.
- Normally when income increases, the demand for a good increases.
- This applies for normal goods.
- The opposite applies for inferior goods, where their demand decreases when income increases.
Calculating YED
- The coefficient of income elasticity of demand for a good can be calculated by dividing the percentage change in quantity demanded by the percentage change in income.
- YED = percentage change in demand/percentage change in income
- YED = %ΔQD/%ΔY
Note: Negativity is very important in YED! Make sure to not confuse this with PED, where it is irrelevant whether the coefficient is positive or negative.
- If the coefficient is negative (inverse relationship) then the good is inferior.
- If coefficient is positive (direct relationship) then the good is normal.
YED Coefficient of Different Goods
YED > 0
- The quantity demanded of the good increases as the consumer income increases and vice versa.
- This means the good is normal.
0 < YED < 1
- A change in income leads to a proportionally smaller change in quantity demanded.
- This means it is a necessity good.
YED > 1
- A change in income leads to a proportionally greater change in quantity demanded.
- A proportionally greater change in quantity demanded.
- Goods with a YED greater than 1 are luxury goods.
- Goods with very high YED coefficients are called superior goods.
- Superior goods are non-essential goods that people start buying once their income increases beyond a certain point.
YED = 0
- A change in income leads to no change in quantity demanded, the closer the YED is to zero, the more needed the good is.
- This means the good is a necessity good.
YED = 1
- A change in income leads to a proportionally equal change in quantity demanded.
- This tends not to occur in reality.
YED < 0
- An increase in income leads to a decrease in demand, and vice versa.
- This means the good is inferior.
Engel Curves
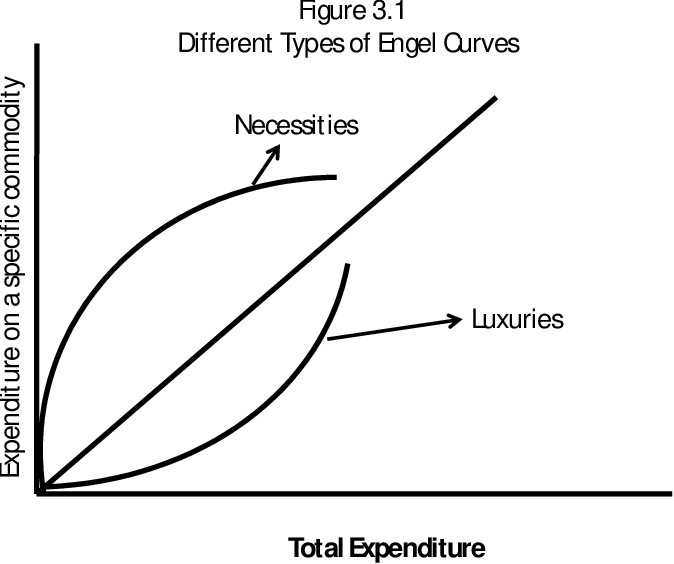
- Engel curves are a type of graph show the relationship between income and quantity demanded.
- The graph plots total expenditure of a population on the x-axis and the total expenditure for a specific good on the y-axis.
- Total expenditure increases as income increases, meaning it shows how the total expenditure of the good increases compared to increases in income.
- The shape of the curve is different depending on the type of good.

- For necessity goods and inferior goods, their demand will skyrocket once income begins to increase from very little.
- Once income has reached a certain point, the curve for necessity goods begins to flatten as people don't buy more of them.
- The curve for luxury goods continuously increases.
Example: If you were homeless and managed to get hired, you would likely spend most of your income on basic necessities such as bread and water. However, as your income increases you won't buy more and more bread and water as you can only eat and drink so much. Instead you'll replace some part with luxury goods such as pasta and juice. If you get promoted and your income becomes very high, then you'll likely start spending money on superior goods such as gourmet meals and wine, which cost more than pasta and juice. With increasing income your spending on luxury goods increases, whereas your spending on necessities usually flattens out or decreases after a certain point.
Economic Growth and YED
- In times of economic growth, incomes typically rise.
- During an economic decline, incomes typically fall.
- As an economy grows over time, the relative size of these sectors as a percentage of total output in the economy, changes.
- This phenomenon is called sectoral change.
- Economists use YED to understand what in increase in income will do to each sector.
- Given the state of the economy, businesses who know their YED can determine if their product is an inferior or normal good and forecast sales and earnings.
- Also firms have often different models of a product targeted at different market segments, knowing income changes and YED helps them in planning operations.
Example: A car manufacturer has a standard version of a car model and a deluxe version of the same model. The standard version has lower YED than the deluxe version. If there is an economic boom, then they will begin producing more of the deluxe version, as people will be more willing to purchase it over the standard model as they have more incomes.
Sectors of an Economy
- Primary: Primary commodities such as agriculture, mining, forestry.
- Secondary: Goods produced from primary commodities such as clothes, cars, houses, books and paper.
- Tertiary: Goods that are not yet tangible but improve quality of life such as entertainment, healthcare, insurance and education.
Income and Spending
- As income-level changes over time, this can cause the entire output of an economy to shift to different sectors.
- Consumers will change the way they spend larger portions of their income.
- As the income of consumers increases, their spendings tend to shift or increase only in certain aspects.
- People generally spend less on agriculture, so the primary sector.
- The secondary sector will grow with economic growth.
- The tertiary sector will begin to increase as well, albeit slower than the secondary sector.
Sources