What is Anthropometrics?
- Anthropometrics is the aspect of ergonomics that deals with body measurements, particularly those of size, strength and physical capacity.
- It derives from the Greek words 'anthropos' (meaning human), and 'metron' (meaning measure).
Use of Anthropometrics
- Design is human-centered, and thus designers need to ensure that the products they design are the right size for the user and are comfortable to use.
- Designers have access to data and drawings, which state measurements of human beings of all ages and sizes.
- Designers need to consider how users will interact with the product or service.
- Use and misuse is an important consideration.
- Therefore the design should be tolerant to user errors and safe to use for the target demographic.
- For example children's toys tend to be very bulky and durable, due to their unrefined motor skills.
Anthropometric Data
- The actual data is collected using a range of different tools, such as (sliding) calipers, skinfold calipers, measuring tapes and stadiometers.
- Such tools are used to collect data relating to body parts; they measure the size of the parts e.g. hand size etc.
Using Anthropometric Data for Designing
- Know who you are designing for.
- Anthropometric information is provided in tables and divided up into different ages, gender and nationalities.
- Work out which body measurements are important.
- It is vital to know which parts of the body your product needs to accommodate.
- For example a chair and a knife are used by, and thus need to accommodate different parts of the body.
- Define if you are designing for smaller, average or larger people.
- No two people have exactly the same dimensions, but we all fit into one of three categories (5th 50th of 95th percentile range).
Bell Curves
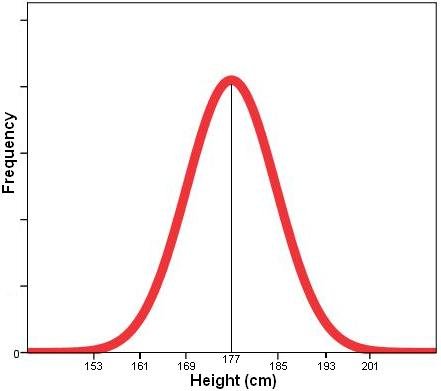
- Bell curves can be a very useful tool to display the different proportions of a population.
- They are graphs that plot the relevant variable on the x-axis, and the number of people on the y-axis.
- In the end, we end up with a curve in the shape of a bell, as most people are in the middle, or 50th percentile, which is the average. The curve then slopes down in both directions, as there are less people in the highest and lowest extremes.

- Height is a common example for bell curves.
- Different sections of the graph are described in percentiles.
Data Types
Static and Structural Data
- Static data consists of measurements of the human body when the subject is still.
- Static/structural data can be used to develop products that are used while the user is in a fixed/still position (e.g. chairs).
- Structural data refers to measurements taken while the subject is in a fixed or standard position, e.g. height, arm length.
Dynamic and Functional Data
- Dynamic data consists of human body measurements taken when the subject is in motion related to range and reach of various body movements.
- E.g. crawling height, overhead reach and the range of upper body movements.
- Dynamic/functional data can be used to develop products that are used while the user is in motion (e.g. running shoes).
- Functional data includes dynamic data measurements while performing a required task e.g. reaching abilities, manoeuvring and aspects of space and equipment use.
Primary and Secondary Data
Primary data collected by the designer/researcher for a specific purpose.
It is collected by the researcher or designer themselves.
This would be carried out if there is a specialized group of people that may not have been studied.
- Secondary data is data collected by someone other than the designer/researcher.
It is collected from a database such as the:
- Ansur Military Database (United States)
- Human engineering for quality of life (Japan)
- Human dimensions of Chinese adults (China)
- Survey of agricultural workers (India)
- Micro census (Germany)
- Health survey (England)
- Nhanes surveys (United States)
- Caesar survey of North American and European adults
Percentile Range
- That proportion of a population with a dimension at or less than a given value.
- For a given demographic (gender, race, age), the 50th percentile is the average.
Sources
https://www.restore.ac.uk/srme/www/fac/soc/wie/research-new/srme/modules/mod1/8/index.html